 eAtlas Data Catalogue
CORAL REEFS
Type of resources
Topics
Keywords
Contact for the resource
Provided by
Representation types
Update frequencies
status
Scale
-
Integrated coral rubble vulnerability map of the Great Barrier Reef (RRAP Rubble Stabilisation, QUT)
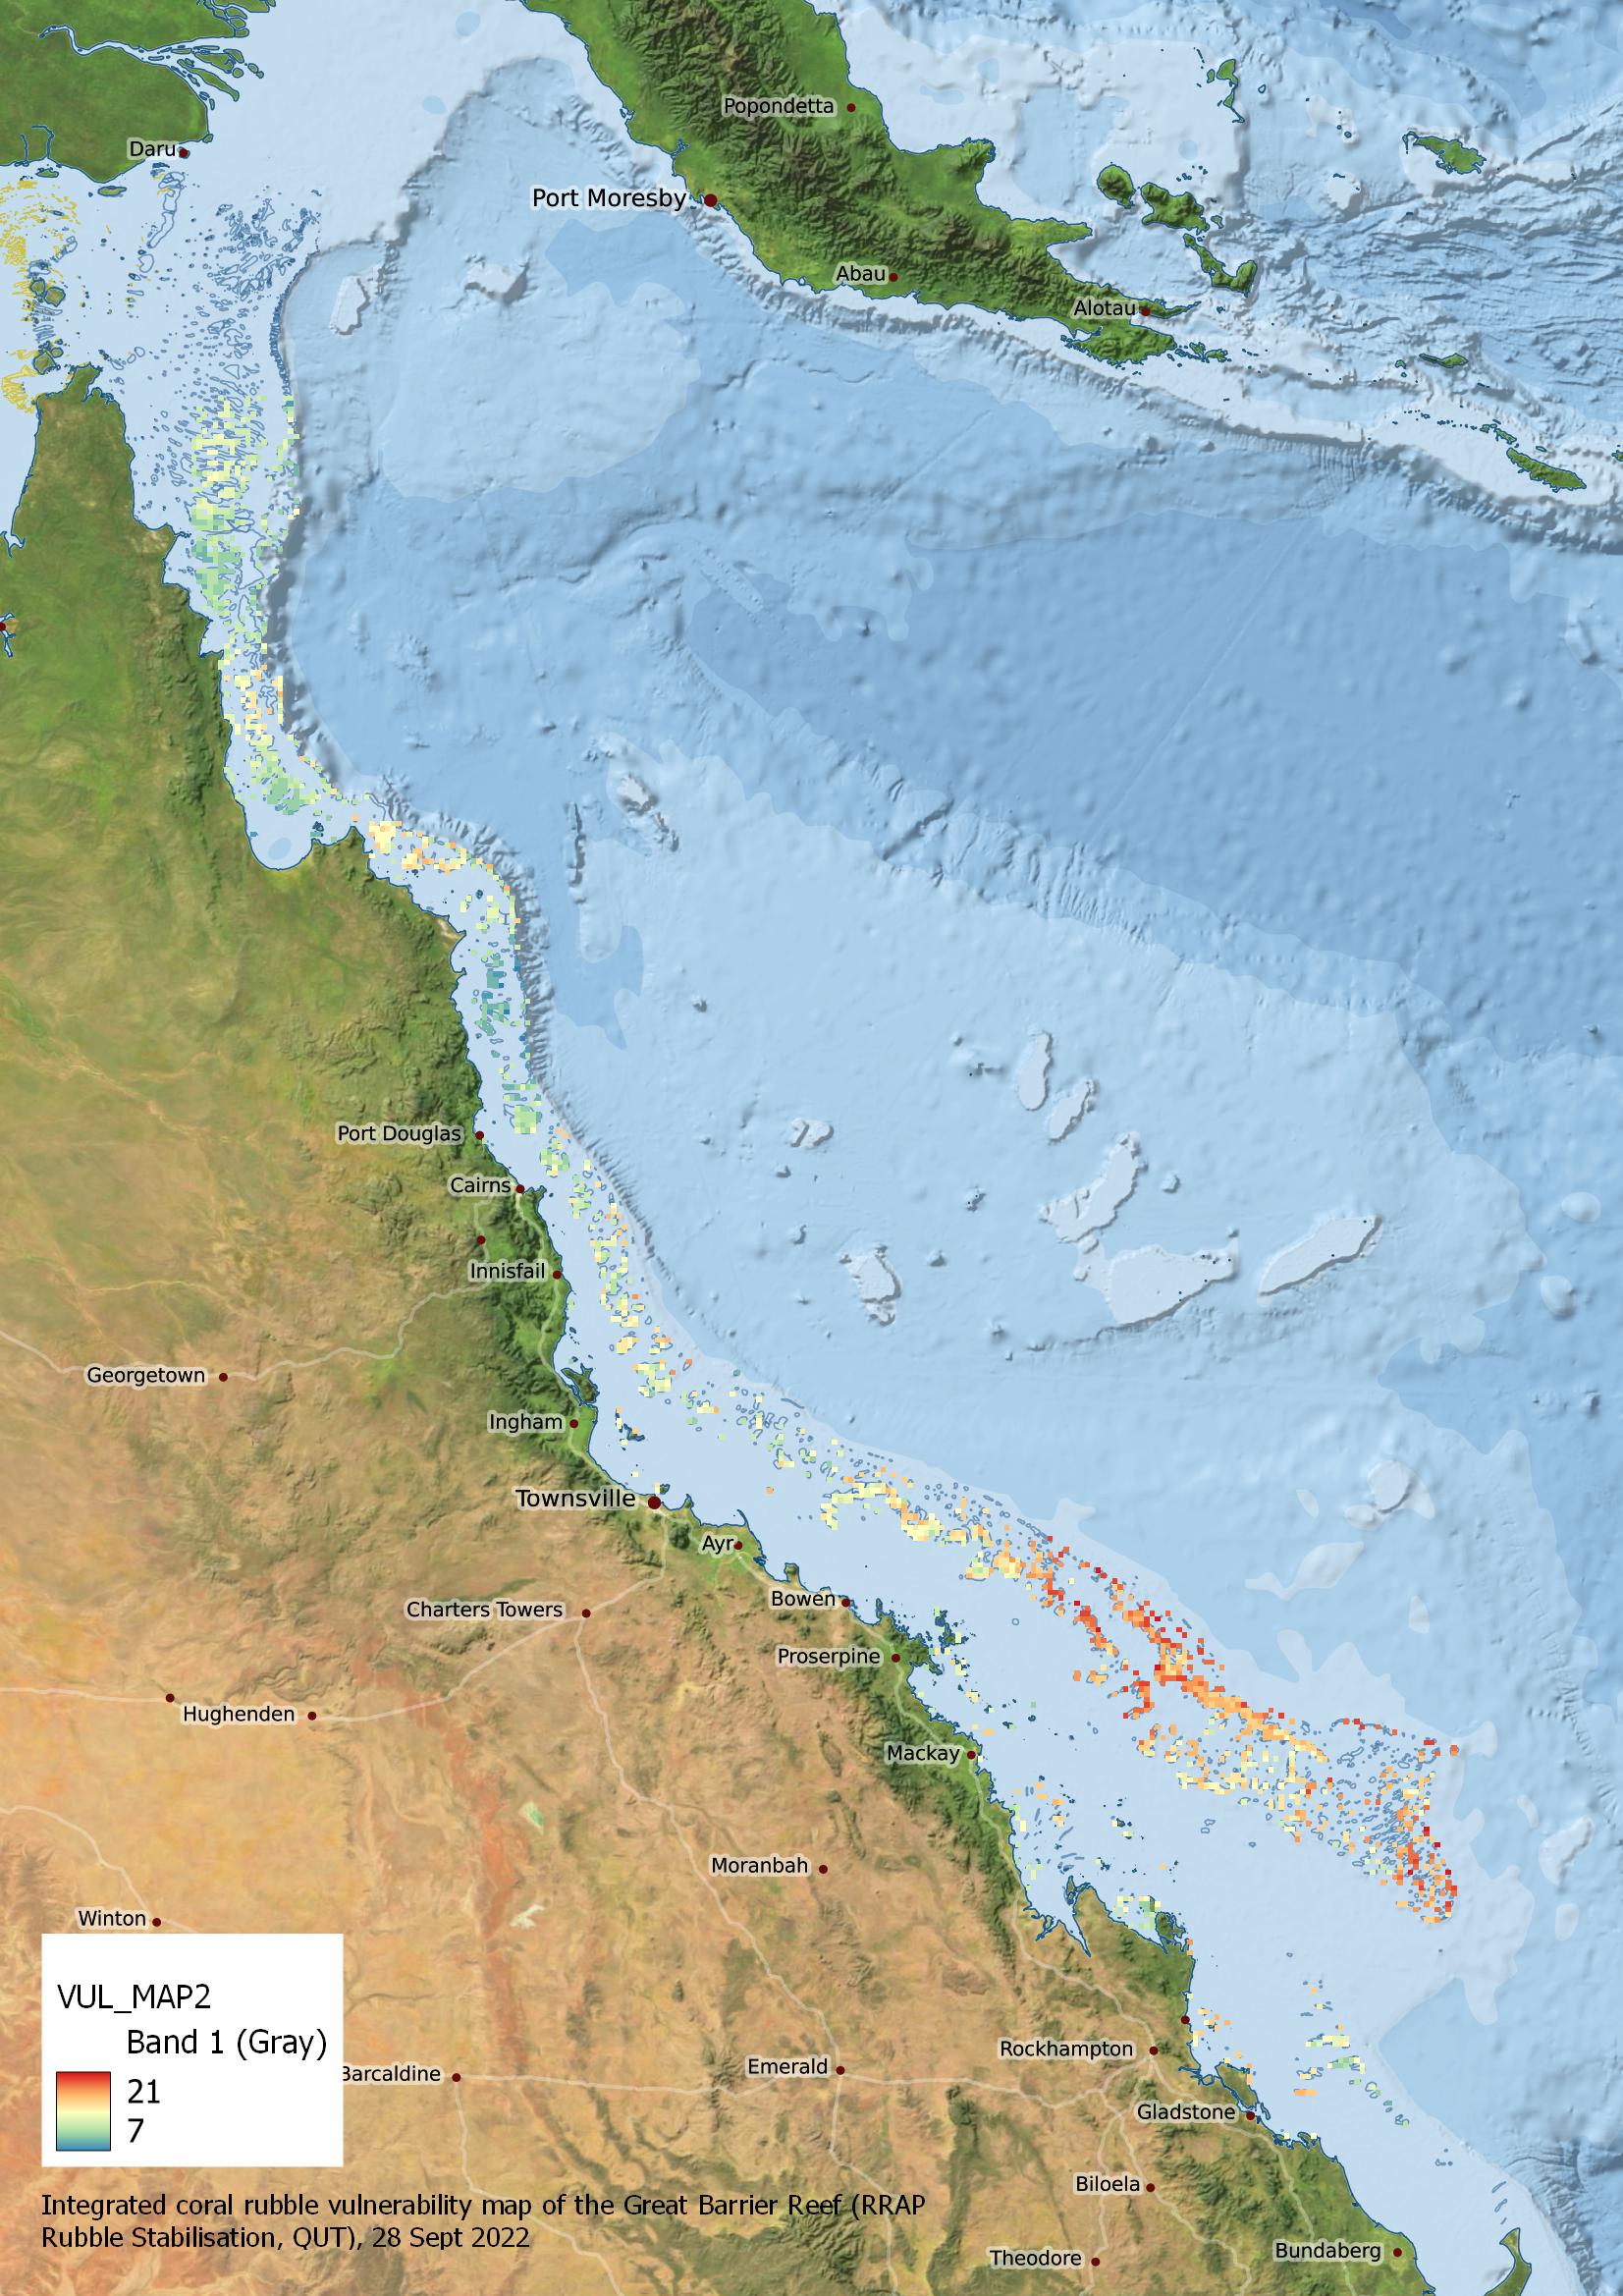
This vulnerability map results from integrating the spatial pattern of the following stressors: cyclonic waves, currents, cyclone tracks, heatwaves (DHW), crown of thorns starfish, and tsunamis. After summarizing historical data and reclassifying each variable into a common scale, they were integrated into a single vulnerability score whose spatial distribution is represented in this map. Methods The coral rubble vulnerability map was calculated by combining GBR wide datasets on currents (2015-2019), cyclone wave statistics (synthetic cyclones), Degree Heating Weeks (DHW) (1986-2021), crown of thorns starfish outbreaks (1985-2017), cyclone tracks (1950-2022), and tsunamis hazard (Probabilistic Tsunami Hazard Assessment, PTHA18). Each of these datasets were converted onto a common 0.005° raster grid (matching the final vulnerability map) using inverse distance weighting (IDW) interpolation for point format datasets (cyclone track points, COTs, tsunamis) and resampling (currents) for raster datasets. For wave and DHW the data was reprojected and resampled on to the common grid. These grids were then clipped to the GBRMPA GBR features reef boundaries. In order to obtain the vulnerability score, each variable was reclassified in ArcGIS Pro, using five equally spaced categories (quantising the data into discrete levels between the minimum and maximum values). As result, all variables ranged from 1 to 5. Finally, all six layers were added up, ignoring no-data pixels. In the case of currents, cyclonic waves and DHW, multiple measures were reviewed and considered. In the index maximum surface current, maximum significant wave height from cyclones and mean DHW were used. Further details of the input data can be found in the ‘Supplementary information - Maps of input data for integrated coral rubble vulnerability map of the Great Barrier Reef’. Limitations This first vulnerability map assumes equal weight for all variables included. There is an ongoing study aiming to test and identify which variables are more correlated with reef damage. This model does not consider the likely accumulation of rubble based on the topology of the reefs. It does not consider the production rate of coral that can result in coral rubble or that some of the inshore reefs particularly in Broad Sound are not coral reefs. Format The spatial model is 1988x2707 pixels with a spatial reference of WGS84 (EPSG:2346). The original dataset is stored in ESRI GRID format (6322 KB), which was converted to a GeoTiff for use in the eAtlas (22 MB). Data dictionary Pixel values in the raster correspond to low vulnerability (7) through to high vulnerability (23)